Materials Environmental and Cost Life Cycle Assessment (MEC·LCA)
User ViewPoint
Usage Case Diagram Actors
General Description
The Materials Environmental and Cost Life Cycle Assessment (MEC-LCA) provides a high-level assessment of the environmental and economic impact of the pilot use cases through the graphical representation of results. The DiMAT MEC-LCA tool will provide user-intelligible outputs based on user input, rather than real-time data or complex sets of data. The users, such as product engineers or decision-makers, will be able to review indicators of the environmental and cost LCAs, as well as information on the pilots’ KPIs (WP2). Information on core life cycle assessment issues, such as identification of environmental and financial hotspots, evaluation of design options performance, and benchmarking will be visualized through the platform’s UI.
Model
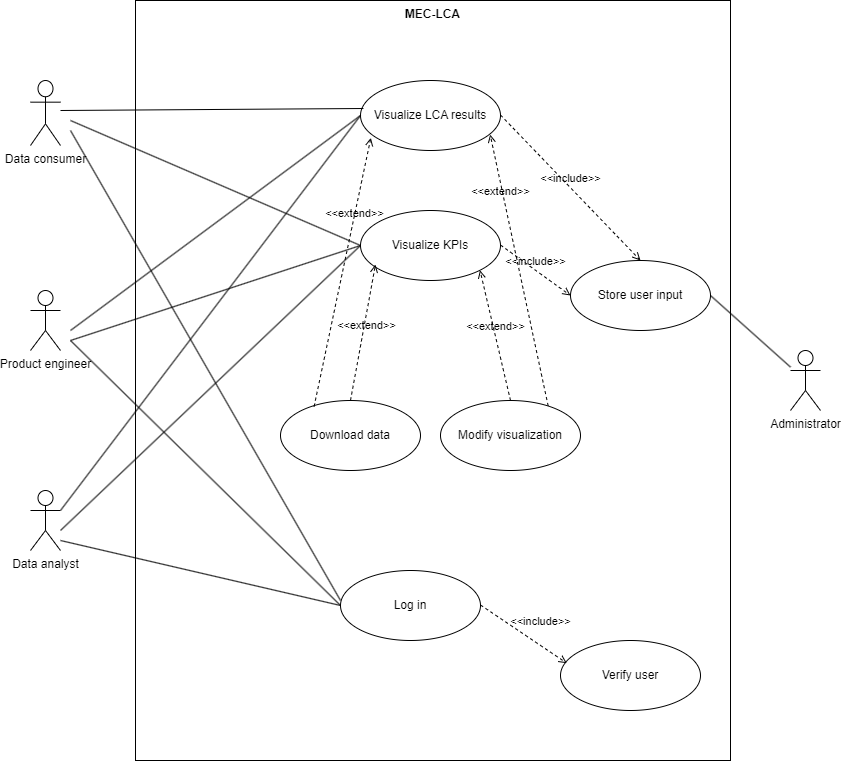
Roles
Data consumer (Manager and Decision Makers Team): In charge of defining business strategy and goals for technological solutions.
Data analyst (Research, Engineering and Product Design Team): In charge of data analysis and creating data products to extract value and gather insights from the data about ongoing processes to assist decision-making.
Product engineer (Research, Engineering and Product Design Team): In charge of products development and defining product requirements.
Administrator (IT team): In this context, the solution provider (developers, maintainers), in charge of the code, configuration and making the toolkit available to users.
Mockups
Activity 1
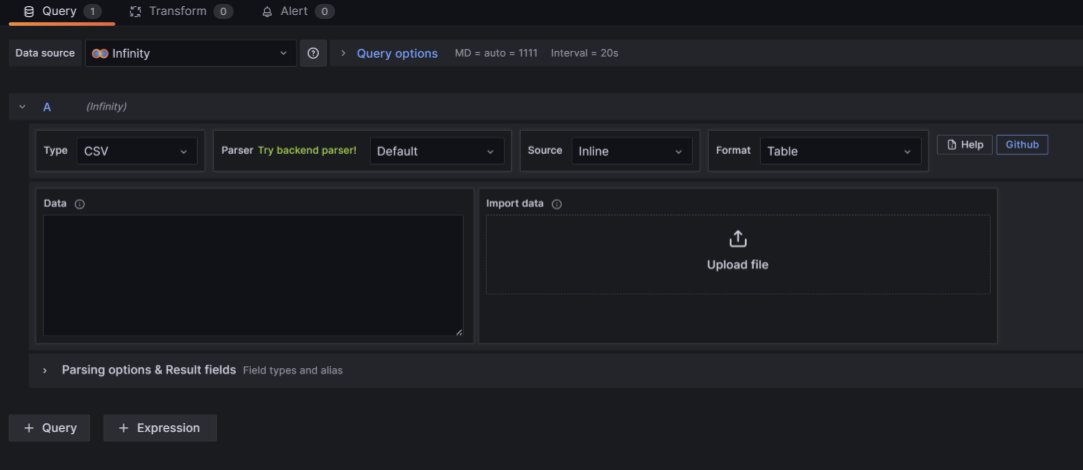
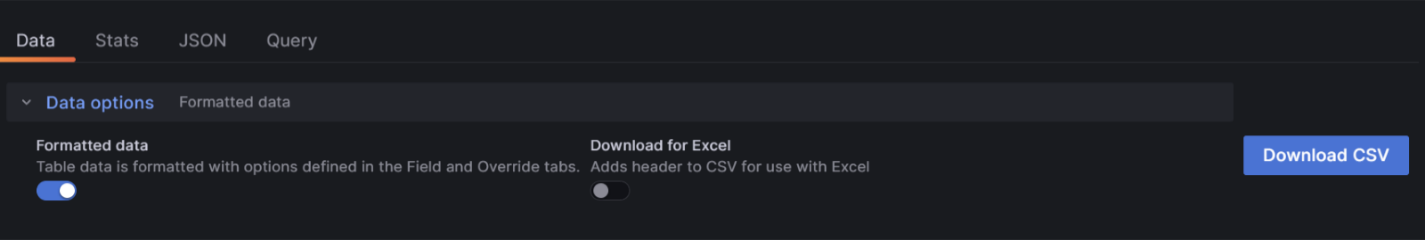
As indicated in the Implementation Viewpoint (T3.5), Grafana will be used and customized as needed to fulfill all the toolkit’s use cases. The screenshots included in the mockup subchapters have been captured during an initial analysis of the system. The final view of the dashboards/UI is expected to differ from what is shown here.
Activity 2
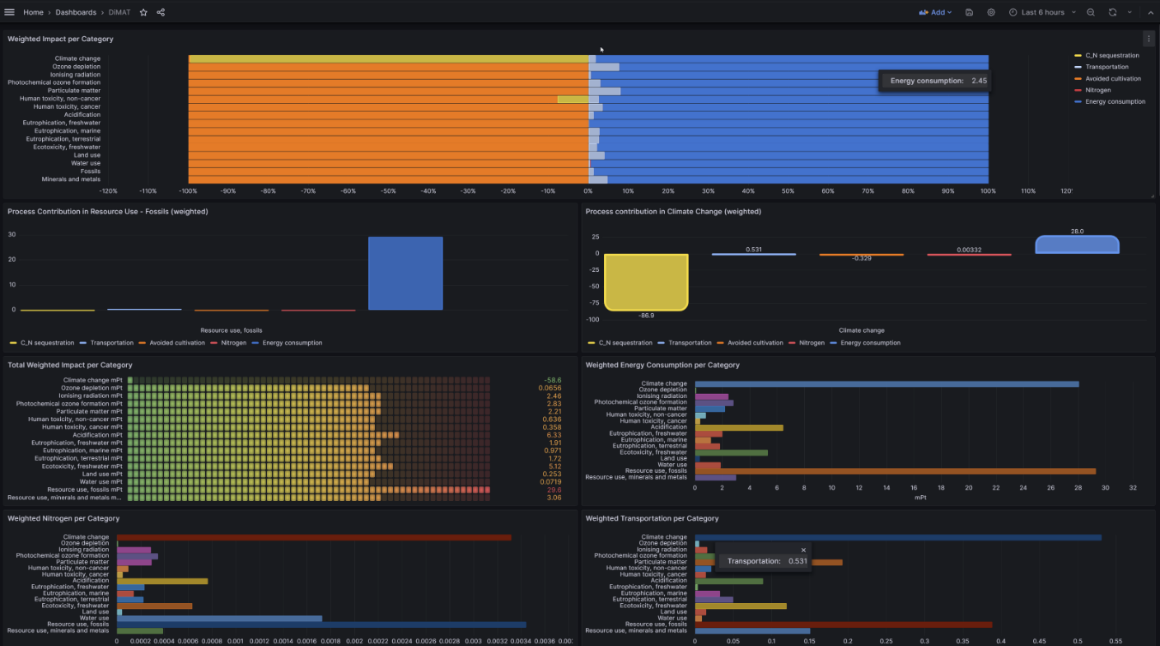
For the visualisations below, test LCA data was used. More visualisation options are available through Grafana.
Activity 3
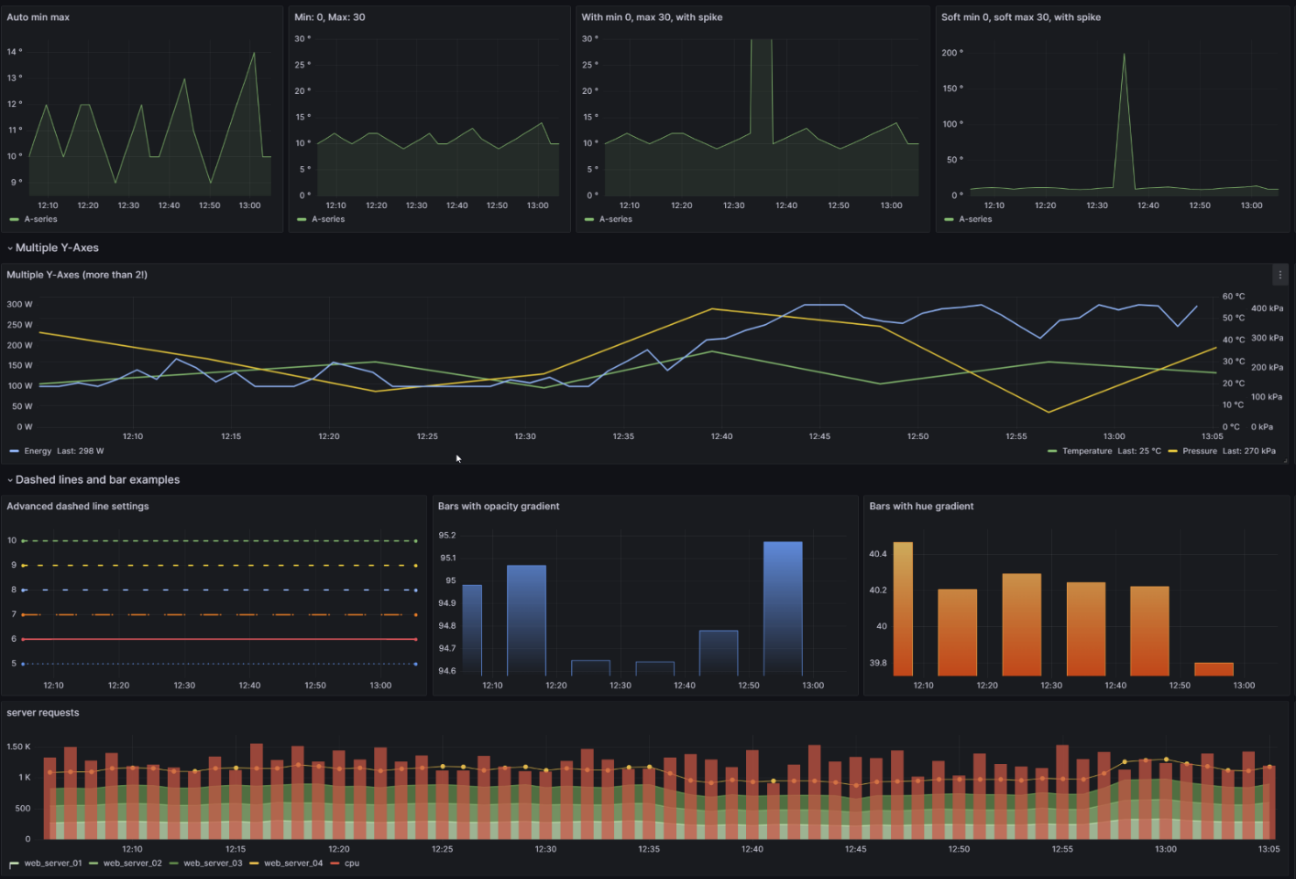
The screenshot below shows some possible visualisations which can be used to display KPIs (among many more available). The screenshot was captured from Grafana’s sandbox environment.
Activity 4
Functional ViewPoint
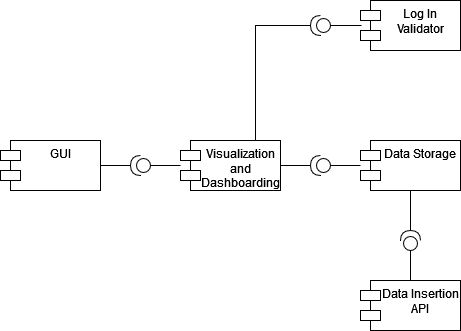
General architecture
Implementation ViewPoint
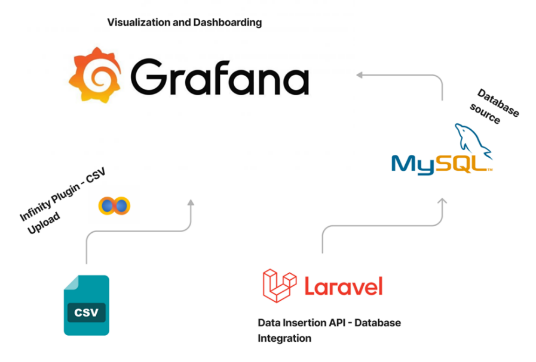
Architecture of Toolkits
The system comprises several components that work together to facilitate the seamless flow of data. The CSV component serves as the data source, allowing users to upload raw data in CSV format. The Infinity plugin component integrates with Grafana, enabling users to effortlessly import and utilize CSV data for visualization and analysis. Grafana acts as the central visualization and dashboarding tool, offering users an intuitive interface to create, customize, and share visualizations based on the data from CSV files and the MySQL database. Laravel plays a critical role in the data flow by handling the integration between the MySQL database and Grafana, ensuring secure and efficient insertion of CSV data. The MySQL database serves as the backend storage and retrieval system, providing a robust solution for storing and managing the uploaded data. Together, these components ensure a smooth and efficient data flow, enabling users to explore and analyze their data effectively within Grafana.
Required components
Hardware componentes
The system architecture incorporates essential hardware components to ensure optimal performance and reliability. The Docker-based setup consists of three primary containers: Grafana, MySQL, and Laravel, all hosted on a dedicated server. The server features robust hardware specifications, including a high-performance processor and ample RAM. This enables efficient data processing, visualization, and data management within the containers. The server’s network infrastructure maintains a stable and high-bandwidth connection, facilitating real-time data ingestion and seamless interactions between the containers. While the Laravel container is available, it is primarily utilized when there is a need to insert CSV data into the MySQL database for specific queries. Laravel provides a powerful framework for handling file uploads and performing database operations, streamlining the insertion process. On the other hand, the system also offers a simpler approach using the Infinity plugin without relying on Laravel. With the plugin, users can directly upload the CSV file through Grafana and visualize the data without the need for additional database operations or integration with Laravel. This provides a user-friendly and straightforward way to display graphs and visualize the data from the specific CSV file.
By optimizing the hardware components on the dedicated server, the system delivers reliable performance, seamless data visualization, and provides the flexibility to utilize either Laravel for CSV data insertion or the Infinity plugin for direct CSV file upload and visualization in Grafana.
Data Storage
The Docker stack comprises three containers: Laravel, MySQL, and Grafana, with each container serving a specific role in the data storage process.
MySQL acts as the primary data storage solution within the stack. It provides a robust and scalable relational database management system for storing structured data efficiently. The MySQL container ensures reliable data persistence and retrieval, facilitating seamless storage and retrieval of Life Cycle Assessment (LCA)/Key Performance Indicator (KPI) data.
Laravel, utilized solely by the admin, enables the creation of seeders to populate the MySQL database with data. By leveraging Laravel’s seeders, the admin can easily insert data into the MySQL database, setting up the foundation for subsequent data querying and analysis.
Grafana, integrated with MySQL as a data source, allows the admin to run queries and perform advanced data analysis when needed. Additionally, the Infinity plugin simplifies data visualization by enabling the direct upload of CSV files into Grafana. The admin can leverage the plugin’s capabilities to create dynamic graphs and visualize LCA/KPI results without relying on complex database queries.
In summary, the combination of Laravel, MySQL, and Grafana forms an efficient data storage solution within the Docker stack. Laravel streamlines the process of populating the MySQL database, MySQL ensures reliable data storage and retrieval, and Grafana, along with the Infinity plugin, provides flexible options for data querying, visualization, and analysis.
Implementation Map
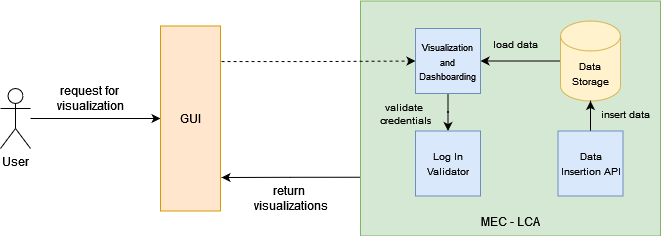
The diagram above gives a high-level view of a user’s request to visualize data stored in the MEC-LCA tool. The user can specify the desired data through the GUI, which communicates the request to the tool. The Visualization and Dashboarding component receive the request and retrieves the necessary data from the Data Storage. Data can be collected by the admin either via direct upload of files into Grafana with the Infinity plugin or by leveraging Laravel for data insertion into the MySQL database through the Data Insertion API. Prior to viewing any content, the user’s credentials must be validated. Finally, the results are returned and displayed to the user through the GUI.