Knowledge Acquisition Framework (KAF)
User ViewPoint
Usage Case Diagram Actors
General Description
The DiMAT KAF toolkit’s objective is to represent knowledge about materials in a structured manner. Besides storing just information about different materials, it also represents relationships among them. The KAF toolkit is based on the development of a Knowledge Graph (KG). The entities of the knowledge graph are going to be concepts like materials and manufacturing processes and the relationships joining these entities reveal links between these concepts. The KG is going to be constructed by employing existing material ontologies (e.g., the EMMO) as well as knowledge deriving from the DiMAT partners. Besides querying the KG for information, the KAF toolkit will support operations such as recommendations on the selection of materials and visualization.
Model
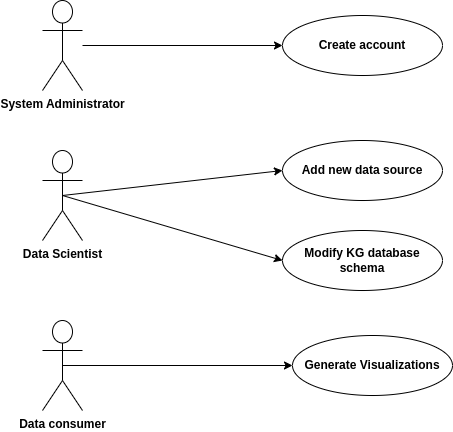
Roles
The roles specified for this toolkit are the following:
System administrator: responsible for supervising the smooth operation of the toolkit, adding or removing eligible users of the toolkit.
Data scientist: person with knowledge on the field of materials, capable of identifying new external data sources that can be incorporated into the toolkit and managing the knowledge graph database schema when updates are necessary.
Data consumer: a stakeholder with interest in accessing the toolkit in order to take advantage of its functionalities, such as a materials scientist or engineer, a researcher in the field of either databases or materials.
Mockups
Activity 1
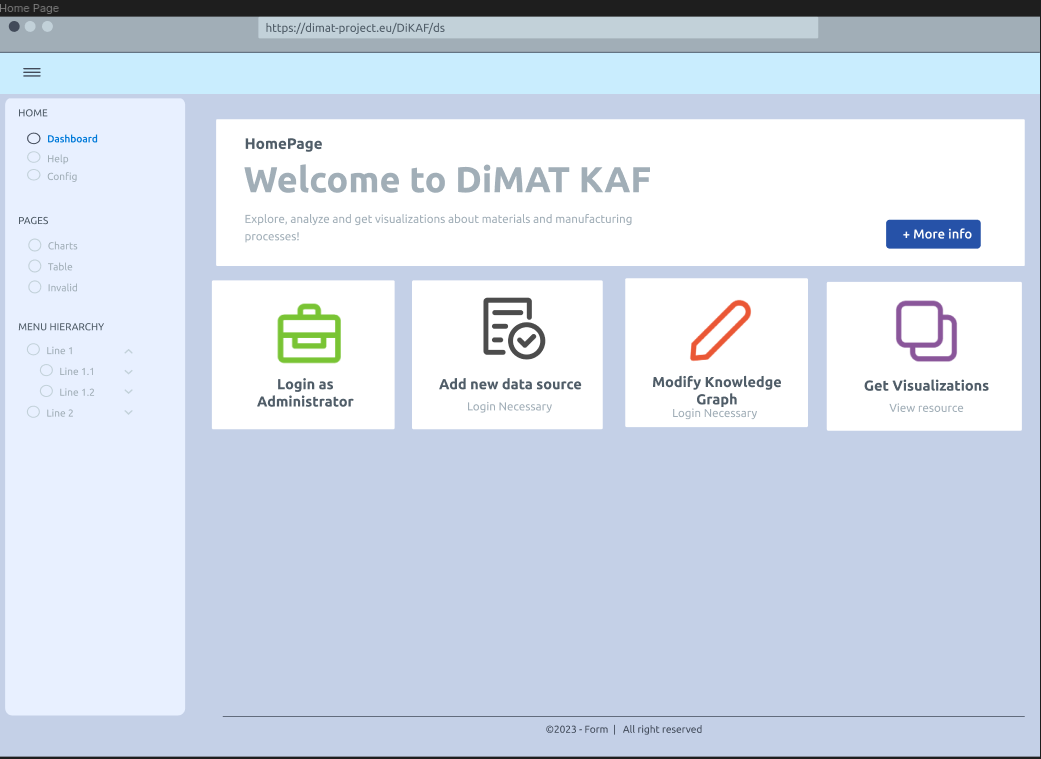
View Homepage
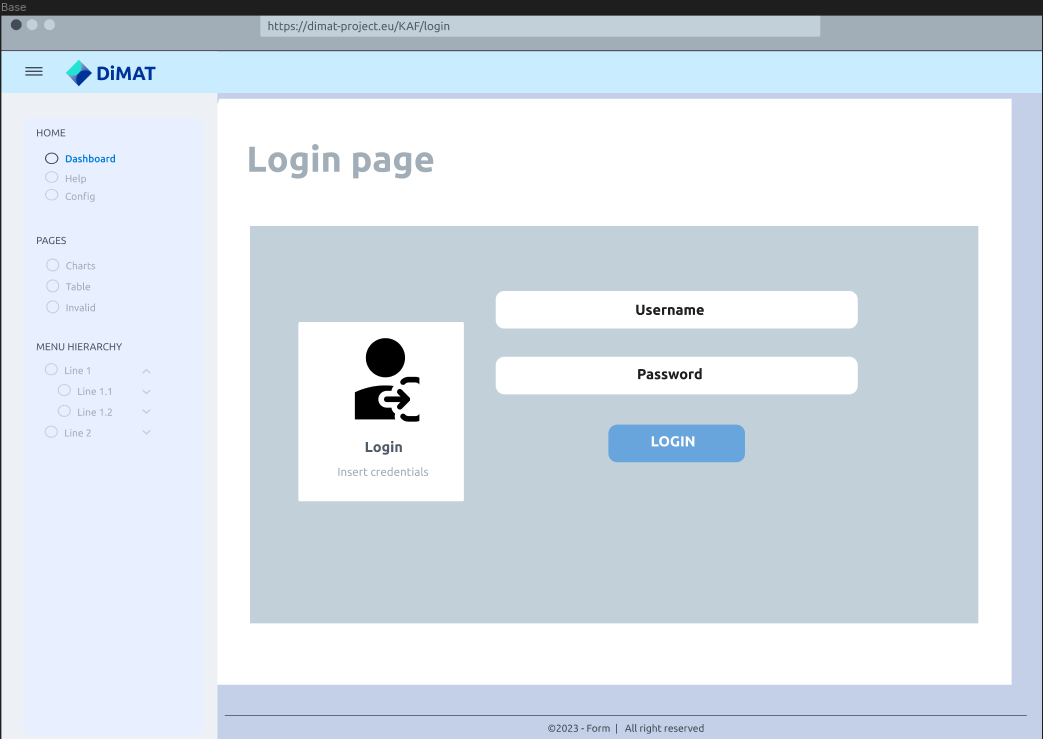
View Login page
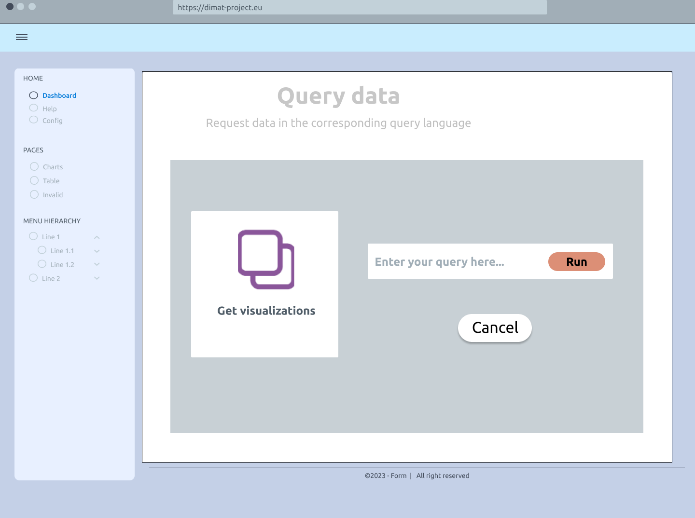
Select method of querying
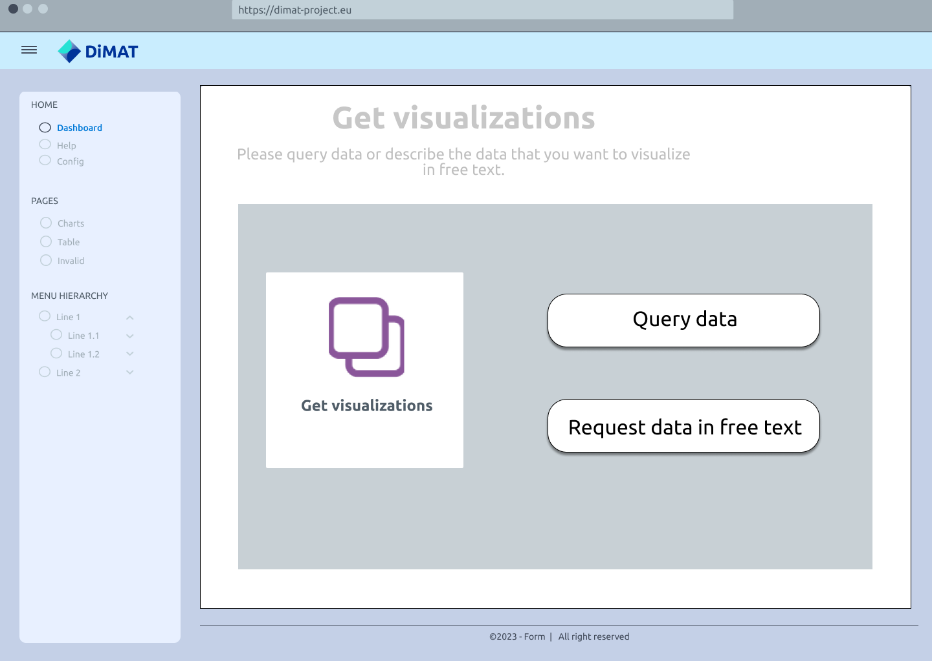
Provide Query
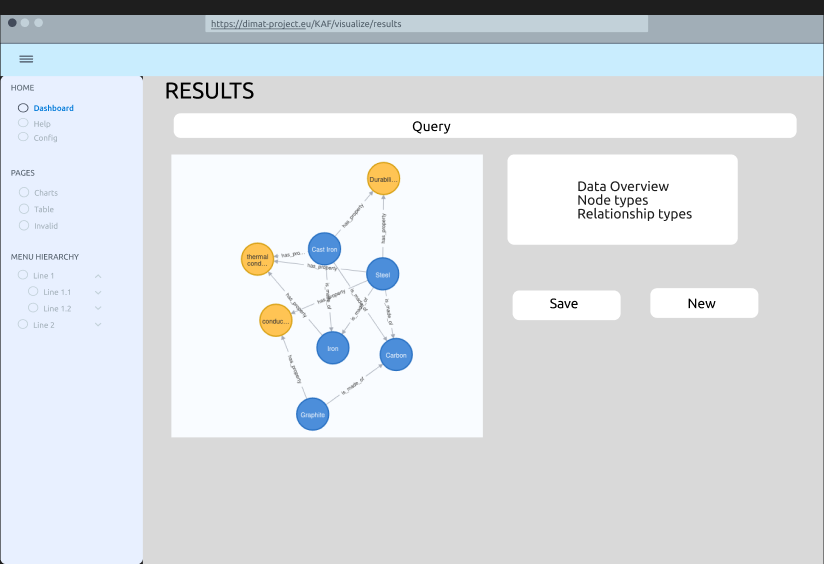
Display visualization results
Functional ViewPoint
General architecture
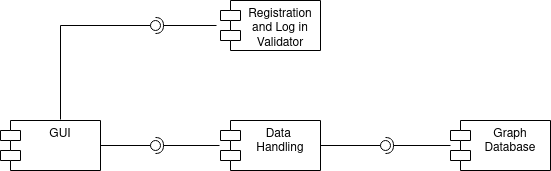
Implementation ViewPoint
Architecture of Toolkits
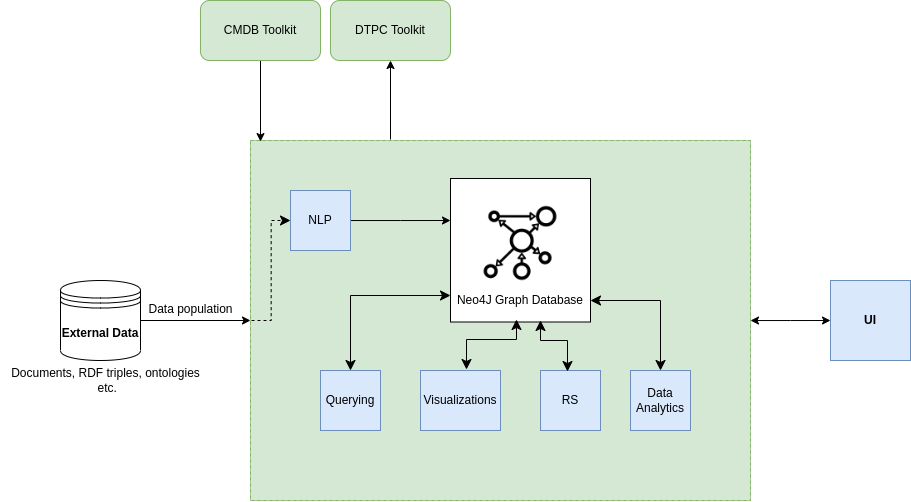
The most central component of the KAF toolkit is the Graph Database (i.e., Neo4J or any other relevant solution). This database is populated with data coming from external sources that are documents describing material processes, RDF triples, or material ontologies, etc. These data, especially text from documents, may require preprocessing such as application of Natural Language Processing techniques. The users can interact with the toolkit via a suitably designed User Interface and request for different functions to be executed on the stored data. Such functionalities include querying, visualization, recommender systems and data analysis tasks in general. In addition, two of DiMAT’s toolkits have a connection to the KAF toolkit. CMDB can be used to access data and populate the graph database, while DTPC can utilize the stored data for the operation of the toolkit’s virtual functions.
Required components
Hardware componentes
Servers: For ensuring the smooth operation of the toolkit, a server with high processing capabilities should be employed (enough CPU cores) capable of running both the software required for storing the data into the Knowledge Graph (KG) format and the software that implements the different functions that operate on the KG data (e.g., visualization, recommender systems, etc.). Also, there should be enough storage space to maintain the Knowledge Graph.
Data Storage
The KAF related data are stored in the Knowledge Graph implemented with the Neo4J knowledge graph database.
Implementation Map
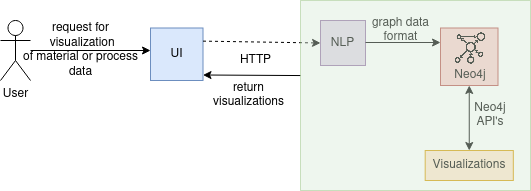
The figure above illustrates, in the form of a diagram, the implementation map of a user requesting to visualize specific data stored in the KAF toolkit. The user specifies the desired data to be further explored and analyzed, through a UI that communicates the request to the toolkit with an appropriate communication protocol, such as HTTP. An NLP component further processes the input in case data is not in a graph data format, and the processed input is passed to the Neo4j Database to perform the suitable queries. By employing Neo4j APIs that communicate with visualization tools, the results are returned and displayed to the user through the UI for further analysis.